When you can see the world clearly, it’s easy to get where you want to go:

You might still get where you want to go after your eyesight has deteriorated, but you are more likely to suffer the costs and delays of making wrong turns:

What distinguishes clear vision from blurry vision is its much higher signal-to-noise ratio, S/N.
When R&D teams do experiments with high S/N, it’s easier for them to get where they want to go, too. However, a lot of experimental data that have been “blurred” by normal random variation have also been “scrambled” by special causes of non-random variation:

When non-random variation differentially biases different slices of the data that we aggregate to build a predictive model or make a decision, both our instincts and our statistical software can easily mistake noise for signal and signal for noise. Although our detailed protocols are intended to control the sources of error that might shift between researchers or drift across time, the widespread Reproducibility Crisis has established that good intentions are seldom good enough at the frontiers of our knowledge. As the quality guru W. Edwards Deming once said, “In God we trust. All others must bring data.”
The key to seeing more clearly in the lab is thus for R&D leaders to help their teams answer these 3 questions before executing each experiment:What is the minimum signal, S, that their experiment is trying to detect?How large is S relative to the random component of their experimental variation, N?Is there demonstrable evidence that they have successfully eliminated the non-random component of variation from their research processes?For example:“S = 20%. If the true effect of the treatment is anything less than a 20% change relative to the control, it might as well be 0% where our R&D team’s bottom line is concerned.”“N = 12%. Because S/N > 3 is our R&D team’s minimum standard for R&D Quality, we must run 4 replicates of each condition.” I.e.,

, but

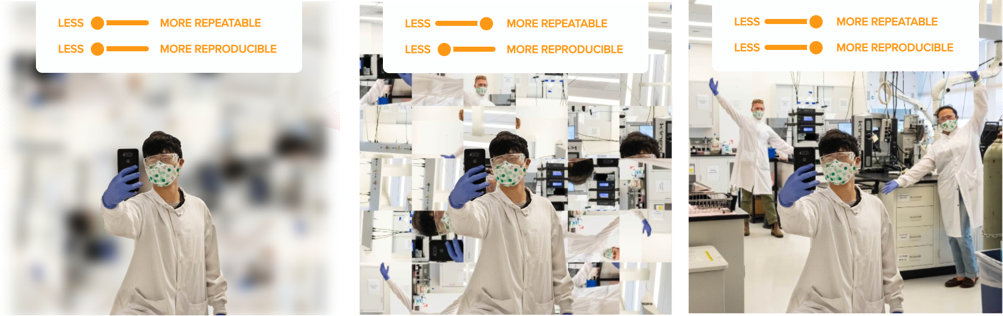
“Although we have never previously tested this particular treatment in this particular way, some critical parts of our new protocol utilize sample preparation techniques and assays that have been demonstrably stabilized by our R&D team’s implementation of Statistical Process Control.”By acting to reduce the size of our random variation, we make our experiments more repeatable. By acting to reduce the frequency of our non-random variation, we make our experiments more reproducible. When we make our experiments both more repeatable and more reproducible, not only will we see the signals in our experiments more clearly, our innate curiosity as scientists and engineers will be repeatedly rewarded and emboldened. We can enter a virtuous cycle of ever more incisive questions and deeper insights that improves teamwork and accelerates R&D.
About the author: Dr. Treynor is the co-founder/CEO of R2DIO Inc and the lead designer of its intelligent R&D I/O software platform that enables biotechnologists to make better measurements, design better experiments and make better decisions with their data. As co-founder/CTO of Treynor Consulting LLC, he is also a leading Scientific and Statistical Consultant and guest lecturer at UC Berkeley, where he teaches how to accelerate bio-product development by making R&D Quality more measurable, more analyzable and more improvable. For more information, please contact the author at ttreynor@r2dio.com.
0 Comments
Leave A Comment