The p-value reports the probability of seeing a difference as large as the observed one, or larger, even if the two samples came from populations with the same mean value. However, and in contrast to a common perception, the p-value does not determine the probability that an observed finding is true!
When conducting multiple comparisons (e.g. thousands of hypothesis tests are often conducted simultaneously when analyzing results from genome-wide studies) there is an increased probability of false positives. While there are a number of approaches to overcome problems due to multiple testing, most of them attempt to reduce the p-value threshold from 5% to a more reasonable value.
In 1995, Benjamini and Hochberg introduced the concept of the False Discovery Rate (FDR) as a way to allow inference when many tests are being conducted. The FDR is the ratio of the number of false positive results to the number of total positive test results: a p-value of 0.05 implies that 5% of all tests will result in false positives. An FDR-adjusted p-value (also called q-value) of 0.05 indicates that 5% of significant tests will result in false positives. In other words, an FDR of 5% means that, among all results called significant, only 5% of these are truly null.
The importance of the FDR can be nicely demonstrated by analysing the following scientific publication:
Published in Nature Medicine in 2014 (Mapstone et al., 2014; Nature Medicine 20, 415–418), the authors discovered a biomarker panel of ten lipids from peripheral blood that predicted phenoconversion to Alzheimer’s disease within a 2-3 year timeframe. Importantly, the described sensitivity and specificity values of the proposed blood test were over 90%. In general, an accuracy of 90% is considered appropriate for any kind of screening test in normal-risk individuals and the reported results triggered a high degree of optimism – but is it justified?
This paper may well represent progress towards an AD blood test, but usefulness depends on what the rate of Alzheimer’s is in the population being screened:
Given a general Alzheimer’s incidence rate of 1%, out of 10,000 people 100 will have a condition and a test based on the described biomarker panel will reveal 90 true positive results (box at top right). However, what about the false positive results! Although 9.900 people do not have any condition, the test will show a false positive result for 990 people (box at bottom right), which leads to a total of 1080 positive results (990 false positives plus 90 true positives). Of these results, 990/1080 are false positives, resulting in a False Discovery Rate of 92%. That is, over 90% of positive screening results would be false!
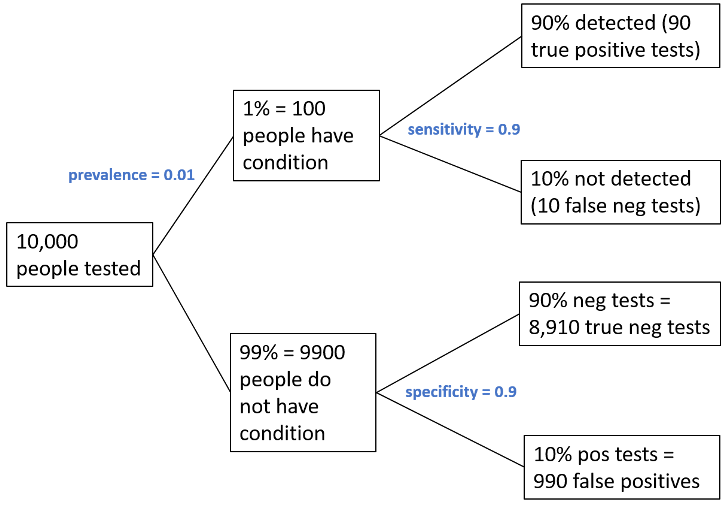
Figure adjusted from (Colquhoun D. 2014, R. Soc. Open Sci. 1: 140216)
As a classic example of Bayes theorem, calculating the FDR clearly demonstrates that a test with a 90% (true positive) accuracy rate is going to misdiagnose (supply a false positive) almost 92% of the tested people (if the actual disease incidence rate is 1%). These sorts of calculations are misunderstood even by people who should know better, e.g. physicians. As can be seen from the above example, a key driver of FDR is the a priori probability of a hypothesis (in this case known incidence of Alzheimer’s). If prior probability is low, FDR will be high for a given p-value. If prior probability is high, FDR tends to be lower.
Consequently, compared to the p-value, the FDR has some useful properties. Controlling for the FDR is a way to identify as many significant tests as possible while incurring a relatively low proportion of false positives. Using the FDR allows scientists to decide how many false positives they are willing to accept among all the results that can be called significant.
When deciding on a cut-off or threshold value, this decision should focus on the question of how many false positive results will this test reveal, rather than just randomly picking a p-value of 0.05 and assuming that every comparison with a p-value less than 0.05 is significant.
0 Comments
Leave A Comment