There is a slow but steady increase in the number of publications where authors report on sample size justification. In most cases, the authors refer to power analysis as the means to estimate sample sizes for their studies. It is also common to read that sample size was estimated for alpha equal to 0.05 and power of 0.8.
We often receive questions whether the power of 0.8 is indeed a recommendation for any study. And the answer is of course “No”.
Power is the probability of rejecting the null hypothesis of no difference when it is in fact false and the alternative hypothesis is correct. There are various calculators that are used to estimate sample size necessary to detect an effect size of interest at given alpha and power. The fact that sample size, effect size, power and alpha are bound by mathematically strict relationships often creates a false impression of precision in estimating power.
However, power is conditional on an effect size of interest (the larger the expected effect the larger the power). Effect size is the size of the difference between groups to be detected, and it indicates the practical significance of a finding. An expected effect size is determined beforehand from pilot studies, the published literature, or best guesses as to what a biologically important difference would look like. Therefore, power critically depends on our estimates of the effect size, which may be very imprecise.
If our assumptions about effect size are wrong, then our expectation that power is in fact 80% will be incorrect (Gelman’s “The 80% power lie”; LINK). Andrew Gelman listed several reasons why our assumptions are likely to be wrong: (a) effects are typically much smaller than people want to believe, (b) effect size estimates from the literature are massively biased, (c) systematic errors, (d) variation across experimental conditions.
And there is one even more important factor that determines how likely our assumptions are to be correct; that is, is our hypothesis about the effect itself correct? What we are really asking is if the probability that a positive result of a study is truly positive. This probability is known as positive predictive value (PPV). It depends not solely on power but even more so on prior odds of a scientific hypothesis being true. John Ioannidis has defined such odds as “the ratio of the number of “true relationships” to “no relationships” among those tested in the field”. High odds can occur when one tests a new chemical entity representing a mechanism of action that is already reasonably well-established in prior studies of this type. For example, the ability of dopamine D2 receptor antagonist to reverse amphetamine-induced hyperactivity in laboratory rodents is well established with a high probability of occurring. In contrast, low odds occur where there is demonstrably high probability of failure. For example, novel drugs tested in the SOD1 mouse model of amyotrophic lateral sclerosis have an extremely high record of failure, even when tested under adequate conditions.
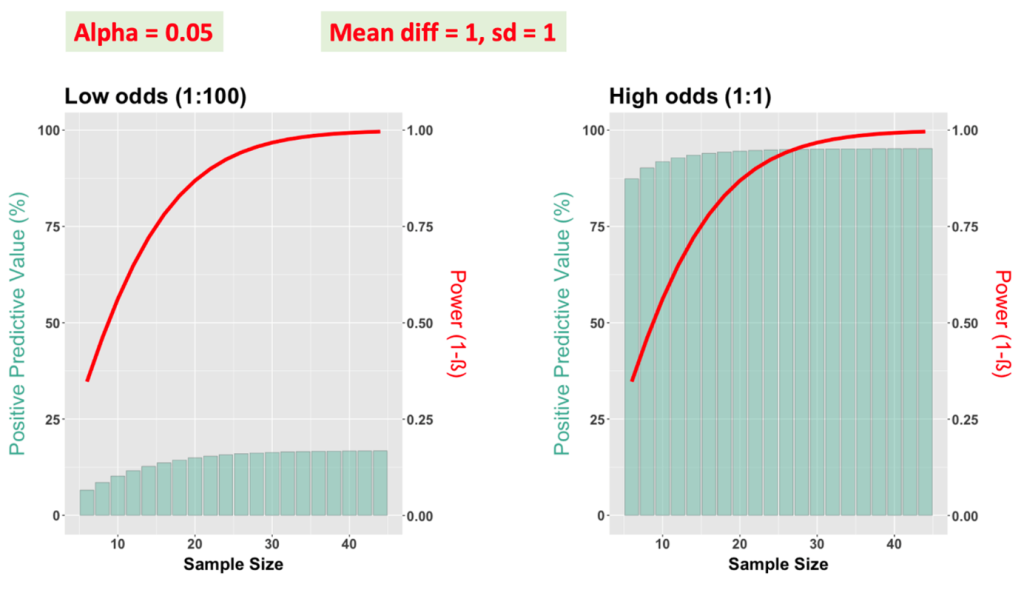
To illustrate the role of PPV, power, and sample size, we performed simulations for four scenarios (R code – LINK). The difference between means of control and experimental groups and standard deviation were set at 1. For alpha equal to 0.05, we have modeled two scenarios – low odds of a study hypothesis being true (1:100) and high odds (1:1).
For both scenarios, the relationship of power and sample size is the same and power starts to level off at sample sizes of 20 subjects per group. What is different is the positive predictive value. For the low-odds scenario, it will stay low even if one uses 100 subjects per group. In contrast, for the high-odds scenario, even with sample sizes <20 subjects per group, the positive predictive value is reasonably high. Thus, our advice is: When the odds of a study hypothesis being true are rather high, lower power may be acceptable and there is usually no need to plan for power greater than 0.8.
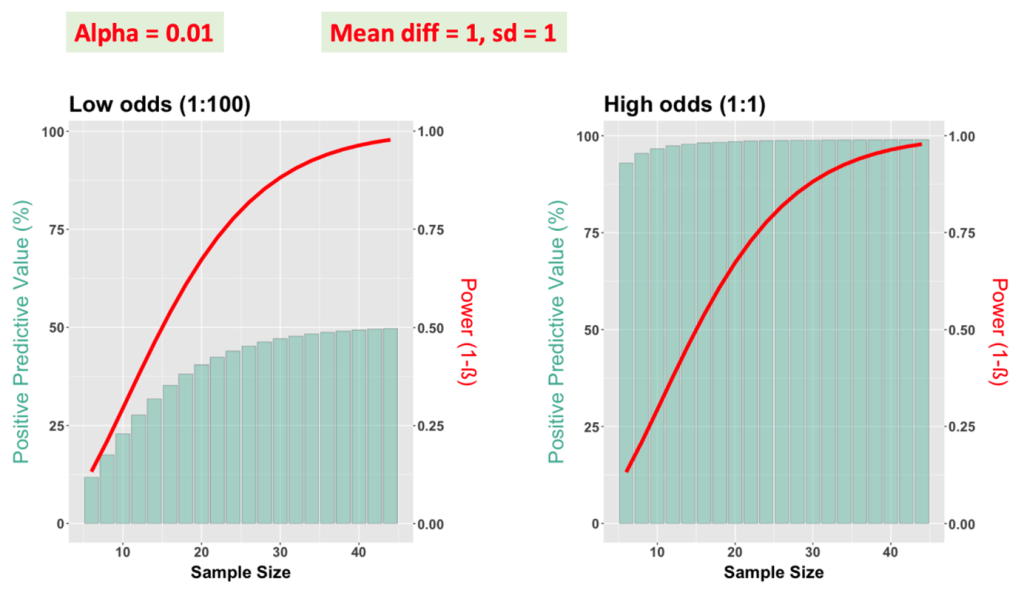
In case of a study hypothesis with low odds, one may want to follow a second strategy: adjusting the value of alpha, as shown below. In this example, PPVs were generated for alpha equal to 0.01. We see it becomes possible to achieve greater positive predictive value with the same power of 0.8. Thus, when the odds of a study hypothesis being true are rather low, estimate sample size with lower alpha (e.g., 0.01) before considering power greater than 0.8. If the result is positive, a confirmatory experiment will be highly desired (LINK).
Finally, when estimating a sample size, we advise generating a range of scenarios with different values for alpha and estimates for mean differences and sample variation. However, because actual power is likely to be lower than predicted, we advise running a power analysis that also accounts for the probability of a scientific hypothesis being true (PPV). If PPV is very low, no sample size, however large, may have acceptable power.
Acknowledgment
The author thanks Dr. Penny Reynolds (University of Florida) for very stimulating discussions, numerous edits and suggestions.
0 Comments
Leave A Comment