In many fields of biomedical research, in vivo studies traditionally involved the use of male subjects. The situation recently started to change due to both the research community recognizing the negative consequences of omitting female subjects and the clear guidance from funding agencies such as the US National Institutes of Health to include both sexes in research. It is also increasingly understood that including both sexes does not automatically mean larger overall sample sizes (link). As the result, the use of female subjects is increasing and this is clearly a very positive development.
We would, however, like to draw attention to an undesired adverse effect of the newly emerging standard of including both sexes into essentially any in vivo study that lacks a rationale of focusing on just one sex. In short, this issue relates to the pre-specification of the effect of sex (or lack thereof). Researchers do not make ‘sex’ part of the pre-specified study analysis plan but do rather a post hoc analysis of unstructured data.
To illustrate the concern, we have performed a simple simulation experiment using R version 4.3.1 (R script link). Data were simulated to represent the simplest case of two treatment groups (intervention, control) and two subgroups (male, female), balanced sample sizes, equal variances. By design, there were no true overall treatment effect (diff = 0) and no sex-specific effect (diff = 0). Total samples sizes were 16 (8/group), 32 (16/group), 64 (32/group) .
And, with sex included, the effective group sample size is 4/sex/group, 8/sex/group, 16/sex/group.
In each of the 100 independent iterations (repeated three times for three different sample sizes), we had two samples randomly drawn from the same Gaussian distribution and arbitrarily labeled them as ‘intervention’ and ‘control’. If samples are large enough, there should be no differences between them as they are drawn from the same distribution. Half of each sample was randomly designated as ‘male’ and another half as ‘female’ (again, should be no difference between ‘males’ and ‘females’). Then, we did two consecutive analyses.
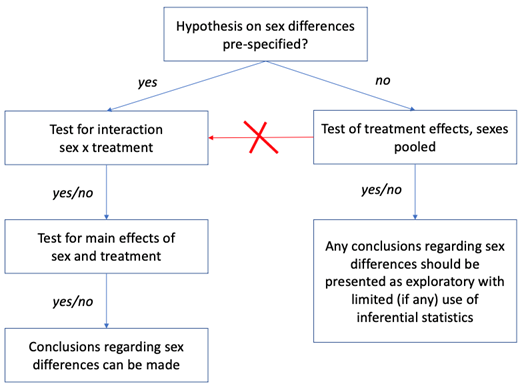
First, as we did not expect any effect of sex and accordingly do not make ‘sex’ part of the pre-specified study analysis plan, the intervention and control groups were compared using two-sided t-test with sexes pooled. As both groups (‘intervention’ and ‘control’) were drawn from the same distribution, comparison of these two groups using t-test yields in 95% of cases a p-value of greater than 0.05.
This is where statistical analysis must normally stop and, while nothing speaks against exploratory analysis of potential sex differences, this must be explicitly labeled as exploratory and should avoid any inferential statistics (see Figure below).
But what happens if one ignores this recommendation and continues the analysis by performing a series of statistical tests on effects of ‘sex’ until any of these would yield a p-value less than 0.05 (the decision path marked in red in the Figure below).
Our second analysis was performed to illustrate consequences of such bad practice. For that, we use the same sets of simulated data for which no differences between ‘intervention’ and ‘control’ were confirmed in the first analysis.
Three additional statistical tests were performed:
i) two-way ANOVA with treatment and sex as independent variables looking at main effects of sex as well as sex x treatment interaction;
ii) for designated ‘males’ only, a t-test comparing ‘intervention’ and ‘control’ groups; and
iii) for designated ‘females’ only, a t-test comparing ‘intervention’ and ‘control’ groups.
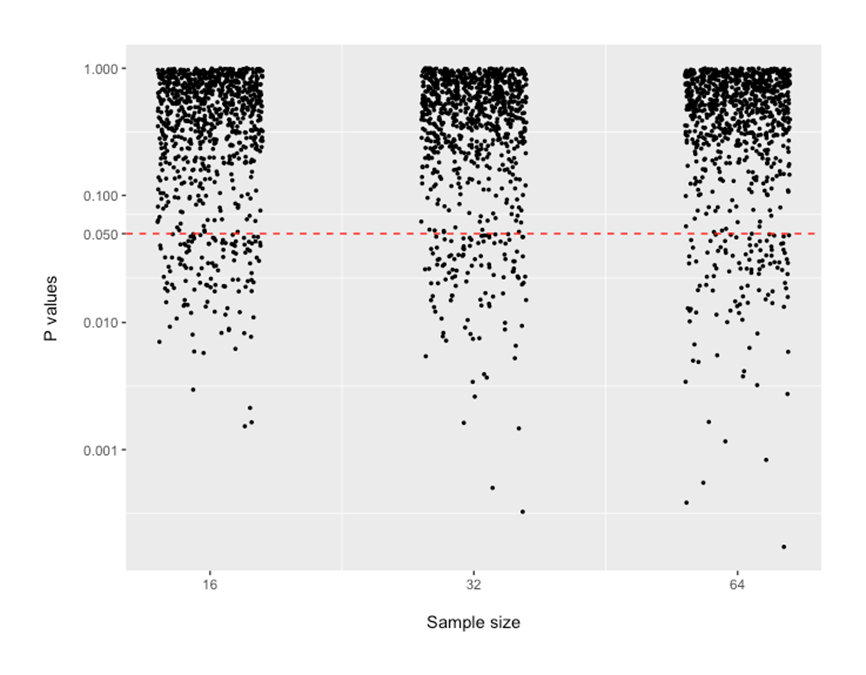
Thus, within this second analysis, there were four additional shots on goal (“p < 0.05”) – sex x treatment interaction and main effect of sex from ANOVA as well as two pairwise intervention vs control comparisons separately within each ‘sex’ subgroup.
P-values from these four analyses are shown below. The values below the dotted red line show outcomes of simulation runs where p-value was suggesting “statistically significant results”. There are 12-20% of the dots that are below the 0.05 line. This rate of “false positive findings” seems to be relatively similar across sample sizes that may be encountered in preclinical research.
The outcome of our simulation experiment is of course obvious to our readers and there are many related examples in the literature. The most famous example was the reporting of the ISIS-2 trial in 1988 (LINK) where the Lancet reviewers wanted subgroup analyses so the authors looked at Zodiac signs to make fun (LINK).
What do these examples teach us?
The call to include both sexes in most study designs puts us at risk of seeing an increase in false positive results reported unless this call is complemented with a very clear instruction to pre-specify any hypothesis related to sex prior to the study conduct (along with primary outcome(s) and analysis methods).
What if one does not pre-specify? The impact of sex can be reported using descriptive statistics (and effect size measures with confidence intervals) but needs to be explicitly labeled as exploratory.
By Anton Bespalov (PAASP) and Penny Reynolds (University of Florida)
0 Comments
Leave A Comment